October 28th, 2025
New
Introducing Advanced Guestii Reporting
We’re excited to announce a major update to Guestii’s reporting capabilities. Providing promoters, venues, and groups with a comprehensive overview of event performance, including attendance, sales, and team activity.
Granular Reporting by Venue & Event
You can now:
Filter by group, single venue, or multiple venues
Select individual events or several events together
Choose custom date ranges (or quick filters like today, this week, this month, last month)
This flexibility means you can quickly analyse how performance varies across nights, promoters, or locations.

Comprehensive Overview & Insights
Your new overview dashboard now includes key performance metrics such as:
Total Invited, Admitted & No-shows
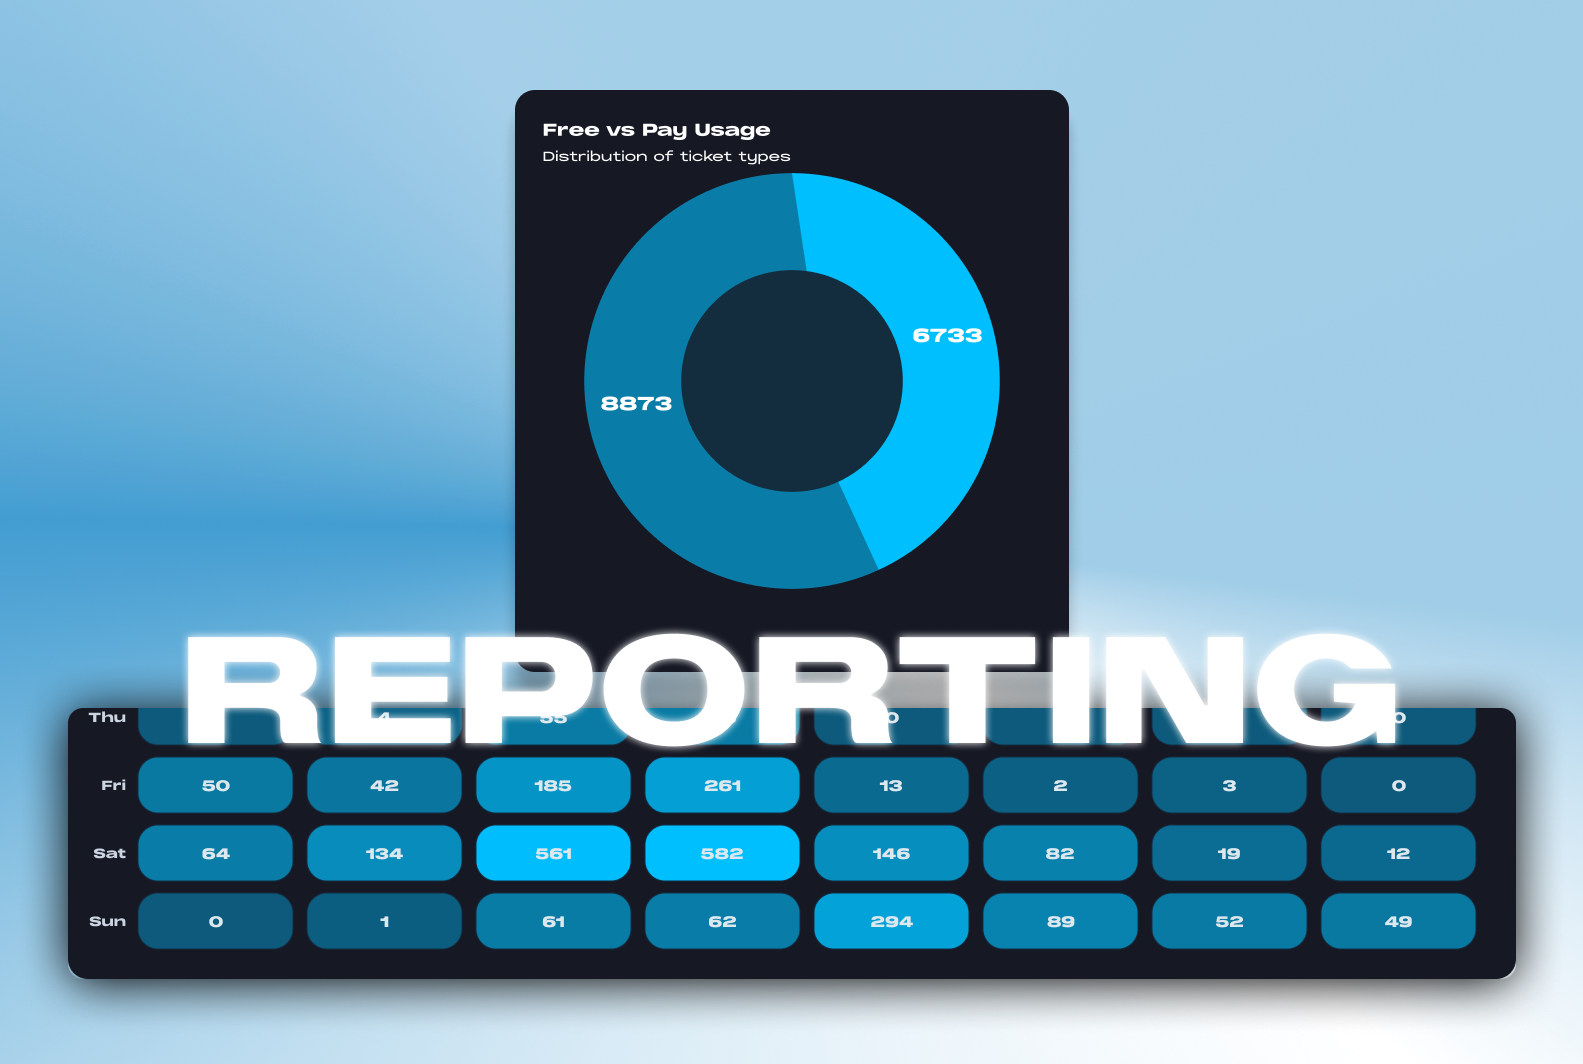
Attendance Rate (split between free and paid tickets)
Top Tags & Conversion Rates with visual charts
These insights help you understand not only how many people showed up, but also who they were and how they got there.
Promoter Performance Breakdown
Drill into each promoter’s individual performance:
See how many invites each promoter issued (free and paid)
Track conversion rates and attendance percentages
Instantly identify your top-performing promoters
Example:

🔥 Peak Time Heatmap
At the bottom of every report, you’ll find a heatmap showing when guests are entering your venue. Use this to:
Identify peak times
Plan door staff, reception, and bar resources more effectively

🤖 BETA TEST: AI Event Insights
We’re also working on AI-powered analytics that will automatically highlight insights. This feature will make it easier than ever to understand your event data without needing to crunch numbers.
Rolling out to selected partners over the coming month.